Why analytics breaks when data is scattered across tools
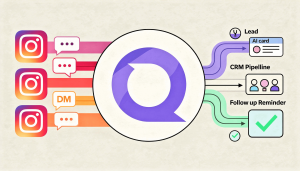
Companies that work across several communication channels such as Telegram, Instagram, Messenger, Viber and their own website run into the same problem. Analytics gets fragmented and data is disconnected. Part of the conversations live in messengers, the sales logic sits in the CRM, and ad spend is hidden inside a dozen different reports. As a result, the business only sees pieces of the picture and spends far too much time trying to understand what is really happening. A classic CRM turns into a manual archive that does not reflect the real state of the business.
The main issues caused by this data gap almost always look the same:
- The manager does not understand why the number of conversations has grown while the number of sales has not.
- The marketing team cannot see which channel actually brings profitable customers instead of just traffic.
- Sales reps do not see their real workload and miss incoming requests.
- The business owner cannot forecast costs and a growing CAC, the cost of acquiring a customer.
The MyChatBot dashboard solves this problem. All data from messengers, advertising and the CRM is collected in one place and updated in real time. There is no need to open five different tools just to understand how things are going today.
What the MyChatBot dashboard shows

The dashboard is designed around how the business actually operates, not around a random set of technical metrics. It shows how the company looks in the moment. How many conversations are in progress, what the current sales pace is, how the workload is changing, when the audience is most active, which channel brings the best results and which scenarios need to be adjusted.
The key performance indicators are grouped into blocks that make sense for the team.
Financial block and sales
- Total sales volume and Number of sales help you quickly assess overall performance.
- Total cost and Average chat cost help you control spending.
- LTV, Lifetime Value shows which channel brings the most profitable customers and how well repeat sales are working.
Communication and AI agent performance
- Active conversations show the current workload for the system and for managers.
- Average conversation length shows how deep the interaction with the customer actually is.
- Breakdown by channel, Revenue, Orders, Messages by Channel shows where customers are coming from.
The analytics layer brings together all connected platforms including Telegram, WhatsApp, Viber, Instagram, OLX and others into a single view of customer interactions. The day by day dynamics, for example Message Usage, helps you plan broadcasts and follow ups in the hours when your audience is most active.
We will connect your CRM, messengers and ad channels to MyChatBot and show live analytics based on your real data.
From guessing to decisions: how companies use MyChatBot analytics
MyChatBot turns archive style data into actionable signals. Below are several examples from real clients.

E commerce and how analytics revealed a gap between interest and sales
A womens clothing store saw a sharp increase in active chats, but sales did not move at all. On the dashboard it became clear that seventeen customers in a row were dropping out at the same stage of the funnel. After the team changed the moment when a human manager joined the conversation, conversion grew from zero to twelve percent in the very first days. The company finally saw what had been invisible before and could fix the problem quickly.
Online targeting school and why eighty percent of leads were stuck in one funnel status
An education project noticed that most of the audience stopped replying after the very first message. The dashboard showed that almost eighty percent of new leads stayed in the undefined status. After the triggers were adjusted and a gentle follow up on the second day was added, the share of leads moving to a consultation grew from twenty one percent to forty two percent. Analytics exposed the real reason for the funnel drop off and made it possible to redesign the scenario.
SaaS B2B and when Telegram ads generated conversations but no leads
The team behind a SaaS product spread the ad budget evenly across several channels but did not understand which channel brought quality opportunities. The MyChatBot dashboard showed that Instagram created fewer conversations, yet they turned into CRM deals twice as often as conversations from Telegram. After the budget was shifted toward the more effective channel, cost per lead went down and the number of qualified inquiries grew without any increase in total spend.
Full synchronization with CRM
MyChatBot integrates with KeyCRM, SalesDrive, Kommo, HubSpot, Zoho, GoHighLevel, Salesforce, Monday CRM, NetHunt, Odoo, Sitniks, Servio, EasyMS and other systems. Deal statuses in the CRM update automatically as soon as the AI agent or a human manager receives new context in a conversation.

This works because the AI agent automatically creates a lead card in the CRM at the moment of the first message and reads key parameters such as budget, city and product directly from the dialog, filling in the CRM fields. The deal status changes at the exact moment when the context of the conversation changes.
The dashboard shows where customers move through the funnel quickly and where the process slows down. If the funnel starts to stall at the consideration stage, you see it right away. If customers get to the proposal stage but do not convert, that is also easy to spot. The company can then adjust scenarios, fine tune the AI agent and change the moment when a human manager joins the conversation.
Advertising analytics and what happened after the click
![]()
Ad managers show impressions, clicks and traffic cost but they do not answer the key question. What happened to the person after the click Did they send a message, did a conversation start, did the dialog reach the CRM, did it end in a sale.
MyChatBot closes this gap with an advertising analytics dashboard. Data from ad platforms is displayed side by side with real conversations, CRM statuses and final outcomes. You can clearly see which traffic turns into inquiries and which traffic simply burns the budget.
The company sees not only click cost or reach, but the entire customer journey. From the very first visit to the moment when the AI agent starts the conversation, a manager joins the deal and the customer makes a decision.
This approach helps you stop guessing which channel works better and start relying on facts. You see how much a real inquiry costs, how many of them turn into leads and which directions generate the most sales. MyChatBot turns scattered data into an operational control center where AI handles the routine and the manager sees a complete picture.
Conclusions: the dashboard as the starting point of daily work
A real time dashboard becomes the place where daily work starts. It is not just a technical tool. It is a way to see how the company lives every minute. The manager sees the state of the funnel. The marketing team sees channel performance. The owner sees sales dynamics and the real health of the business. All of this is available in one place with no delay.
AI handles the operational part and when a sales rep opens the system they see a funnel that reflects reality. This lets them focus on the work that actually drives revenue instead of routine data entry.
Send a short request for a demo and we will show the dashboard in real time and explain how companies in your niche work with it.